Spinning Top and Doji pattern
Candlestick patterns are like footprints left behind in the market. Every candle tells a story — of fear, greed, confidence, or confusion. Among these stories, two candles stand out for representing moments of market uncertainty: the Spinning Top and the Doji. These patterns might seem simple at first glance, but they offer valuable clues to traders who know how to read them.
In this detailed article, we’ll go deeper into what these candles mean, why they matter, and how you can use them effectively — especially when trading around key support or resistance zones. Whether you're a beginner trying to understand candlestick language or a seasoned trader looking for an edge, this guide will give you practical insights to trade smarter.

Both Spinning Top and Doji reflect hesitation — but can lead to big moves.
What is a Spinning Top Candlestick?
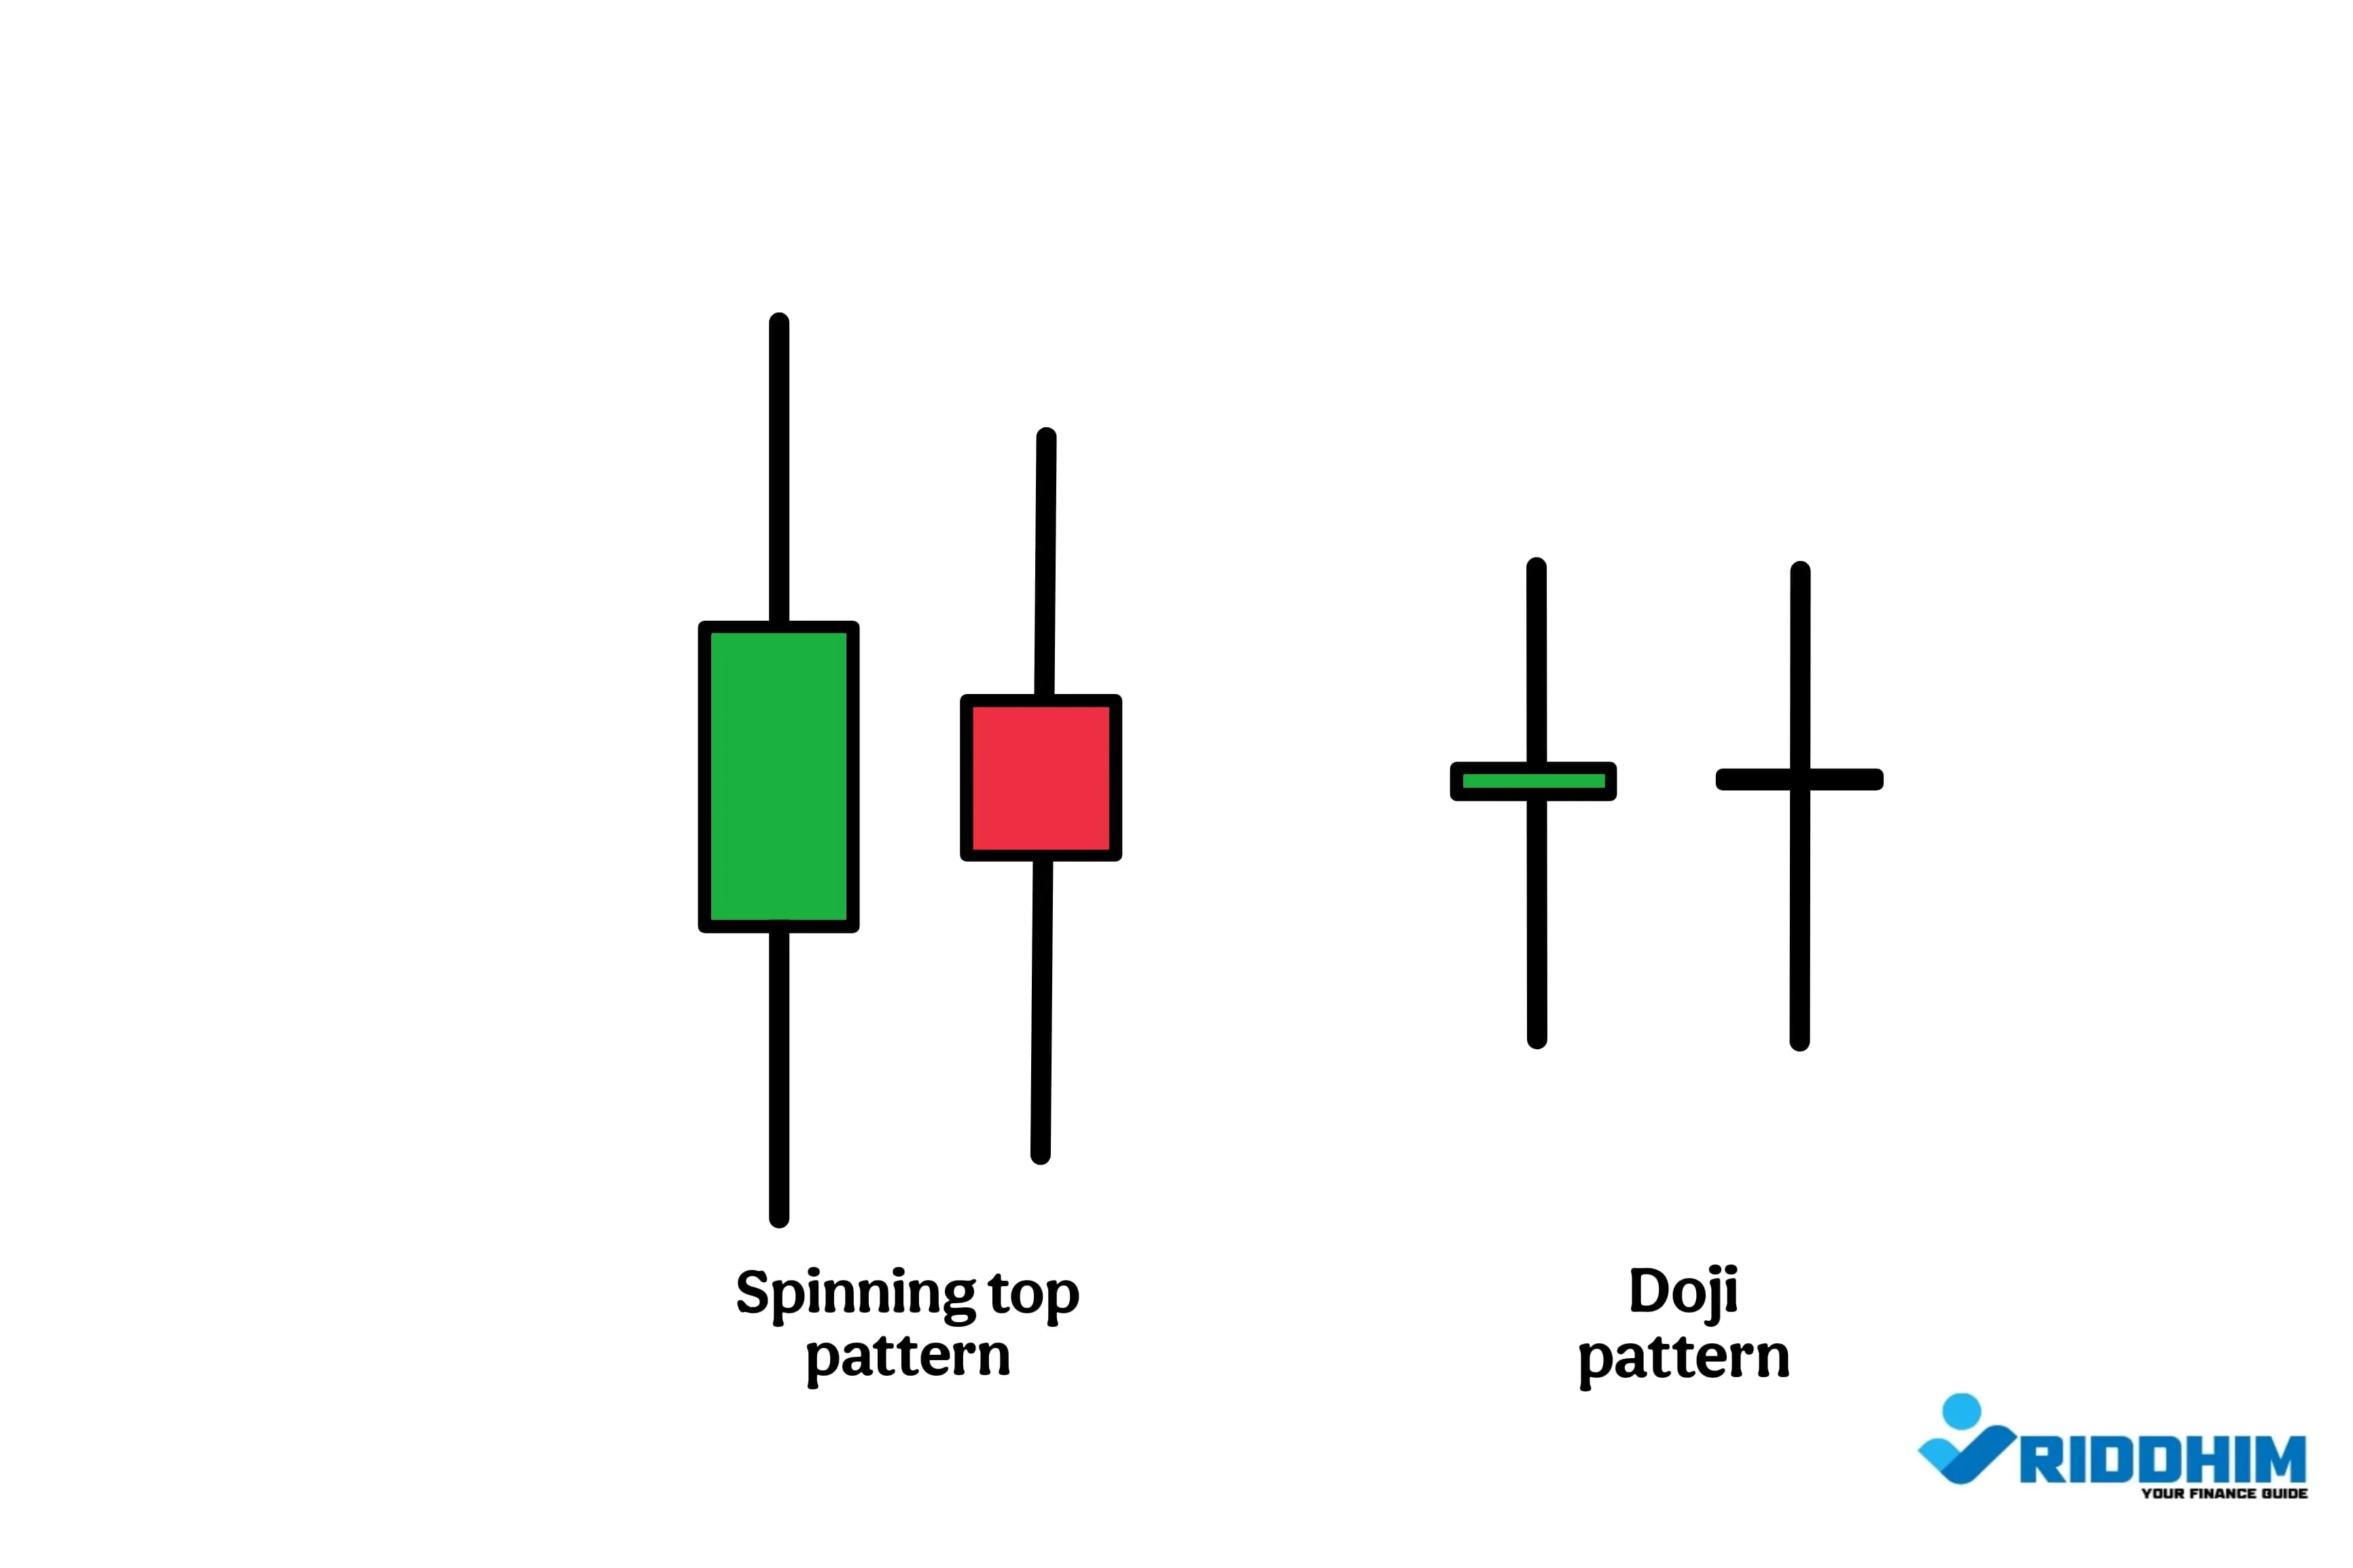
A Spinning Top is a candle that represents balance — or rather, a tug-of-war between buyers and sellers. It has a small real body, which means that the opening and closing prices were close together. However, it also has long upper and lower shadows, showing that prices moved significantly in both directions during the session.
This tells us that neither side could dominate — a classic signal of indecision. When you see a Spinning Top after a strong trend, it’s like the market is pausing to take a breath.
Characteristics of a Spinning Top:
- Small real body — open and close are close
- Long upper and lower shadows — shows volatility
- Signals uncertainty or a potential turning point
For example, imagine a stock has been rising for five straight days. On the sixth day, it opens high, drops sharply, rallies again — but ends up closing near the opening price. That’s a spinning top. It doesn’t confirm a reversal — but it raises a red flag.

Spinning Top shows lack of commitment in price direction.
What is a Doji Candlestick?
If a Spinning Top shows indecision, a Doji shows extreme indecision. In a Doji candle, the opening and closing prices are almost exactly the same. The result is a candle with little or no real body and often long wicks on either side.
It's like the market tried to move in both directions but ended up right where it started. This suggests a total lack of conviction — from both bulls and bears.
Types of Doji Candles:
- Standard Doji: Small or nonexistent body, equal-length shadows
- Gravestone Doji: Long upper shadow, bearish signal at the top of trends
- Dragonfly Doji: Long lower shadow, bullish potential when found at support
- Long-Legged Doji: Wild market swings with no clear resolution
Each of these types offers slightly different signals, depending on the prior trend. But in all cases, the core idea remains: the market doesn’t know what to do next.

Classic Doji patterns near resistance or support zones carry higher weight.
Spinning Top vs. Doji – Spot the Difference
At first glance, these two might look similar. But there’s a critical difference:
- Spinning Top: Small real body with upper and lower shadows
- Doji: Open and close are nearly identical — body is almost invisible
The Spinning Top shows both sides trying — and failing — to gain control. A Doji shows nobody even tried that hard. That distinction is what makes Doji slightly more powerful in signaling reversal, especially at turning points.
Real-World Example
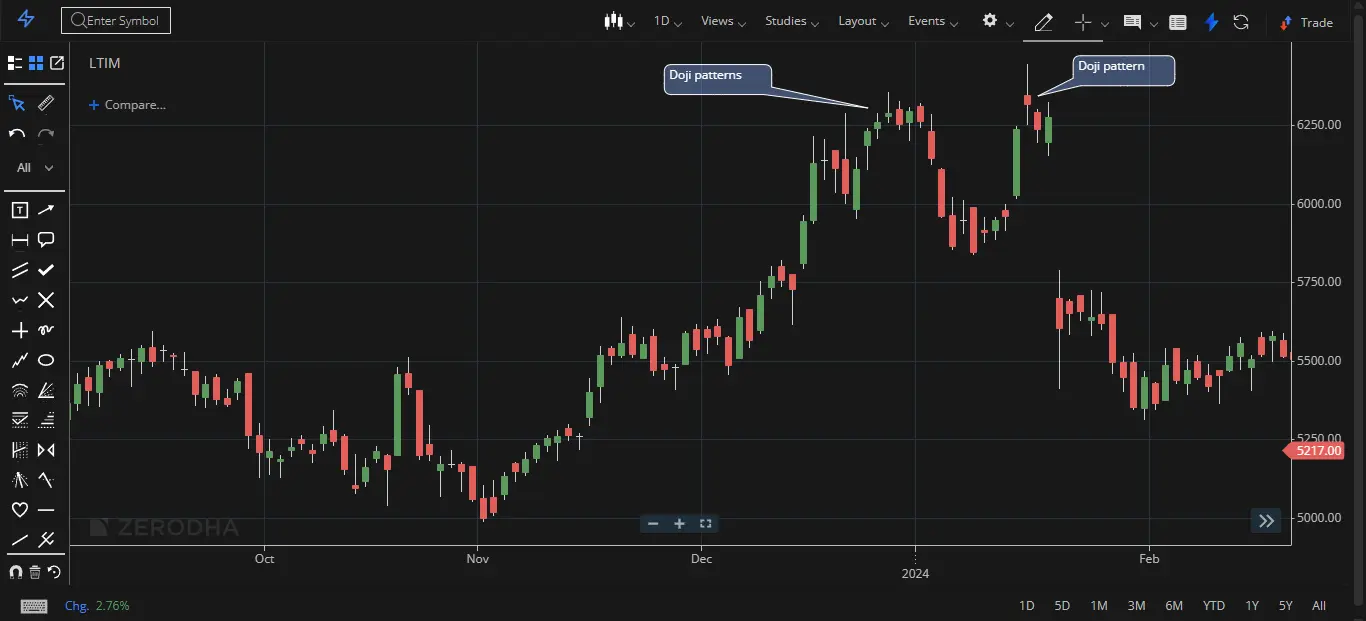
Let’s say Reliance stock is in a strong uptrend. For five days, the price climbs steadily. On the sixth day, a Doji appears — open and close are the same, with a long upper shadow. The next day, the stock opens lower and starts to fall. That Doji was your warning sign.
In another case, let’s say Tata Motors is falling and suddenly prints a spinning top after a long red candle. This suggests bears might be losing steam — and a bounce could follow.
Where They Appear Matters the Most
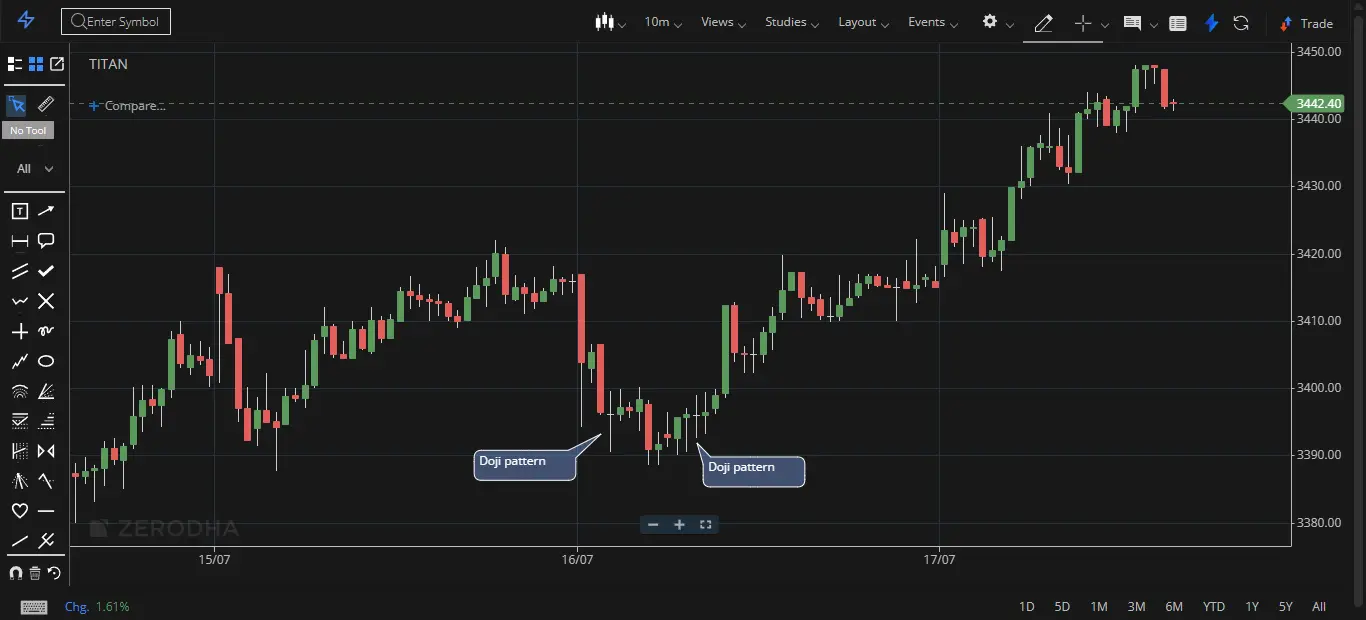
Candlestick patterns don’t work in isolation. A Doji at the top of a strong rally could be a reversal sign. But the same Doji in a sideways market is just noise. Context is king.
Before acting on these candles, ask:
- Is the pattern near a support or resistance zone?
- What was the trend leading up to this candle?
- Are other indicators (volume, RSI, MACD) supporting the signal?
How to Trade Spinning Tops and Doji
Trading these patterns requires discipline and strategy. Here are two approaches:
1. Aggressive (for Risk-Takers)
Enter the trade immediately after spotting the pattern, especially near major levels. Use tight stop-losses just beyond the candle’s high/low. Ideal when you have strong confluence with indicators or news.
2. Conservative (for Safe Traders)
Wait for confirmation. For example, if a Doji appears after an uptrend, wait for the next candle to close lower before shorting. This reduces false signals.
Common Mistakes to Avoid
- Trading every Doji or Spinning Top — not all are meaningful
- Ignoring volume — confirmation is stronger with high volume
- Forgetting the bigger trend — always zoom out first
- Placing trades with no stop-loss — especially dangerous on indecision candles
Summary – What You Should Remember
- Spinning Tops and Dojis are powerful warning signs — not confirmations
- They reflect hesitation and a possible shift in trend
- Always analyze context: trend, volume, and levels
- Trade with confirmation — not just the candle alone
- Use stop-losses. Market can break either way after these candles
Mastering candlestick patterns isn’t about memorizing shapes. It’s about understanding the message behind them. A Doji or Spinning Top is the market whispering, “Something’s changing.” Learn to listen, and you’ll make smarter decisions.