Marubozu Candlestick Pattern
If you’re someone who’s just starting out in the stock market or brushing up on your chart-reading skills, the Marubozu candlestick is one of the simplest yet strongest signals to understand. This unique pattern has no wicks or shadows, just a solid body — making it very clear who dominated the market on that particular day: buyers or sellers.
In this article, you’ll not only understand what a Marubozu candle is, but also how to spot it, trade with it, and combine it with other tools for better results. Whether you’re a day trader, swing trader, or long-term investor looking for smart entry or exit points — this is something you’ll want in your technical toolbox.
What Is a Marubozu Candle?
The word “Marubozu” comes from Japanese, meaning “bald” or “close-shaved.” That’s exactly how this candle looks — it has no upper or lower shadows. Just a clean, strong body that shows clear intention.
- Bullish Marubozu: Opens at the low, closes at the high. Buyers were in control all day.
- Bearish Marubozu: Opens at the high, closes at the low. Sellers dominated from start to finish.
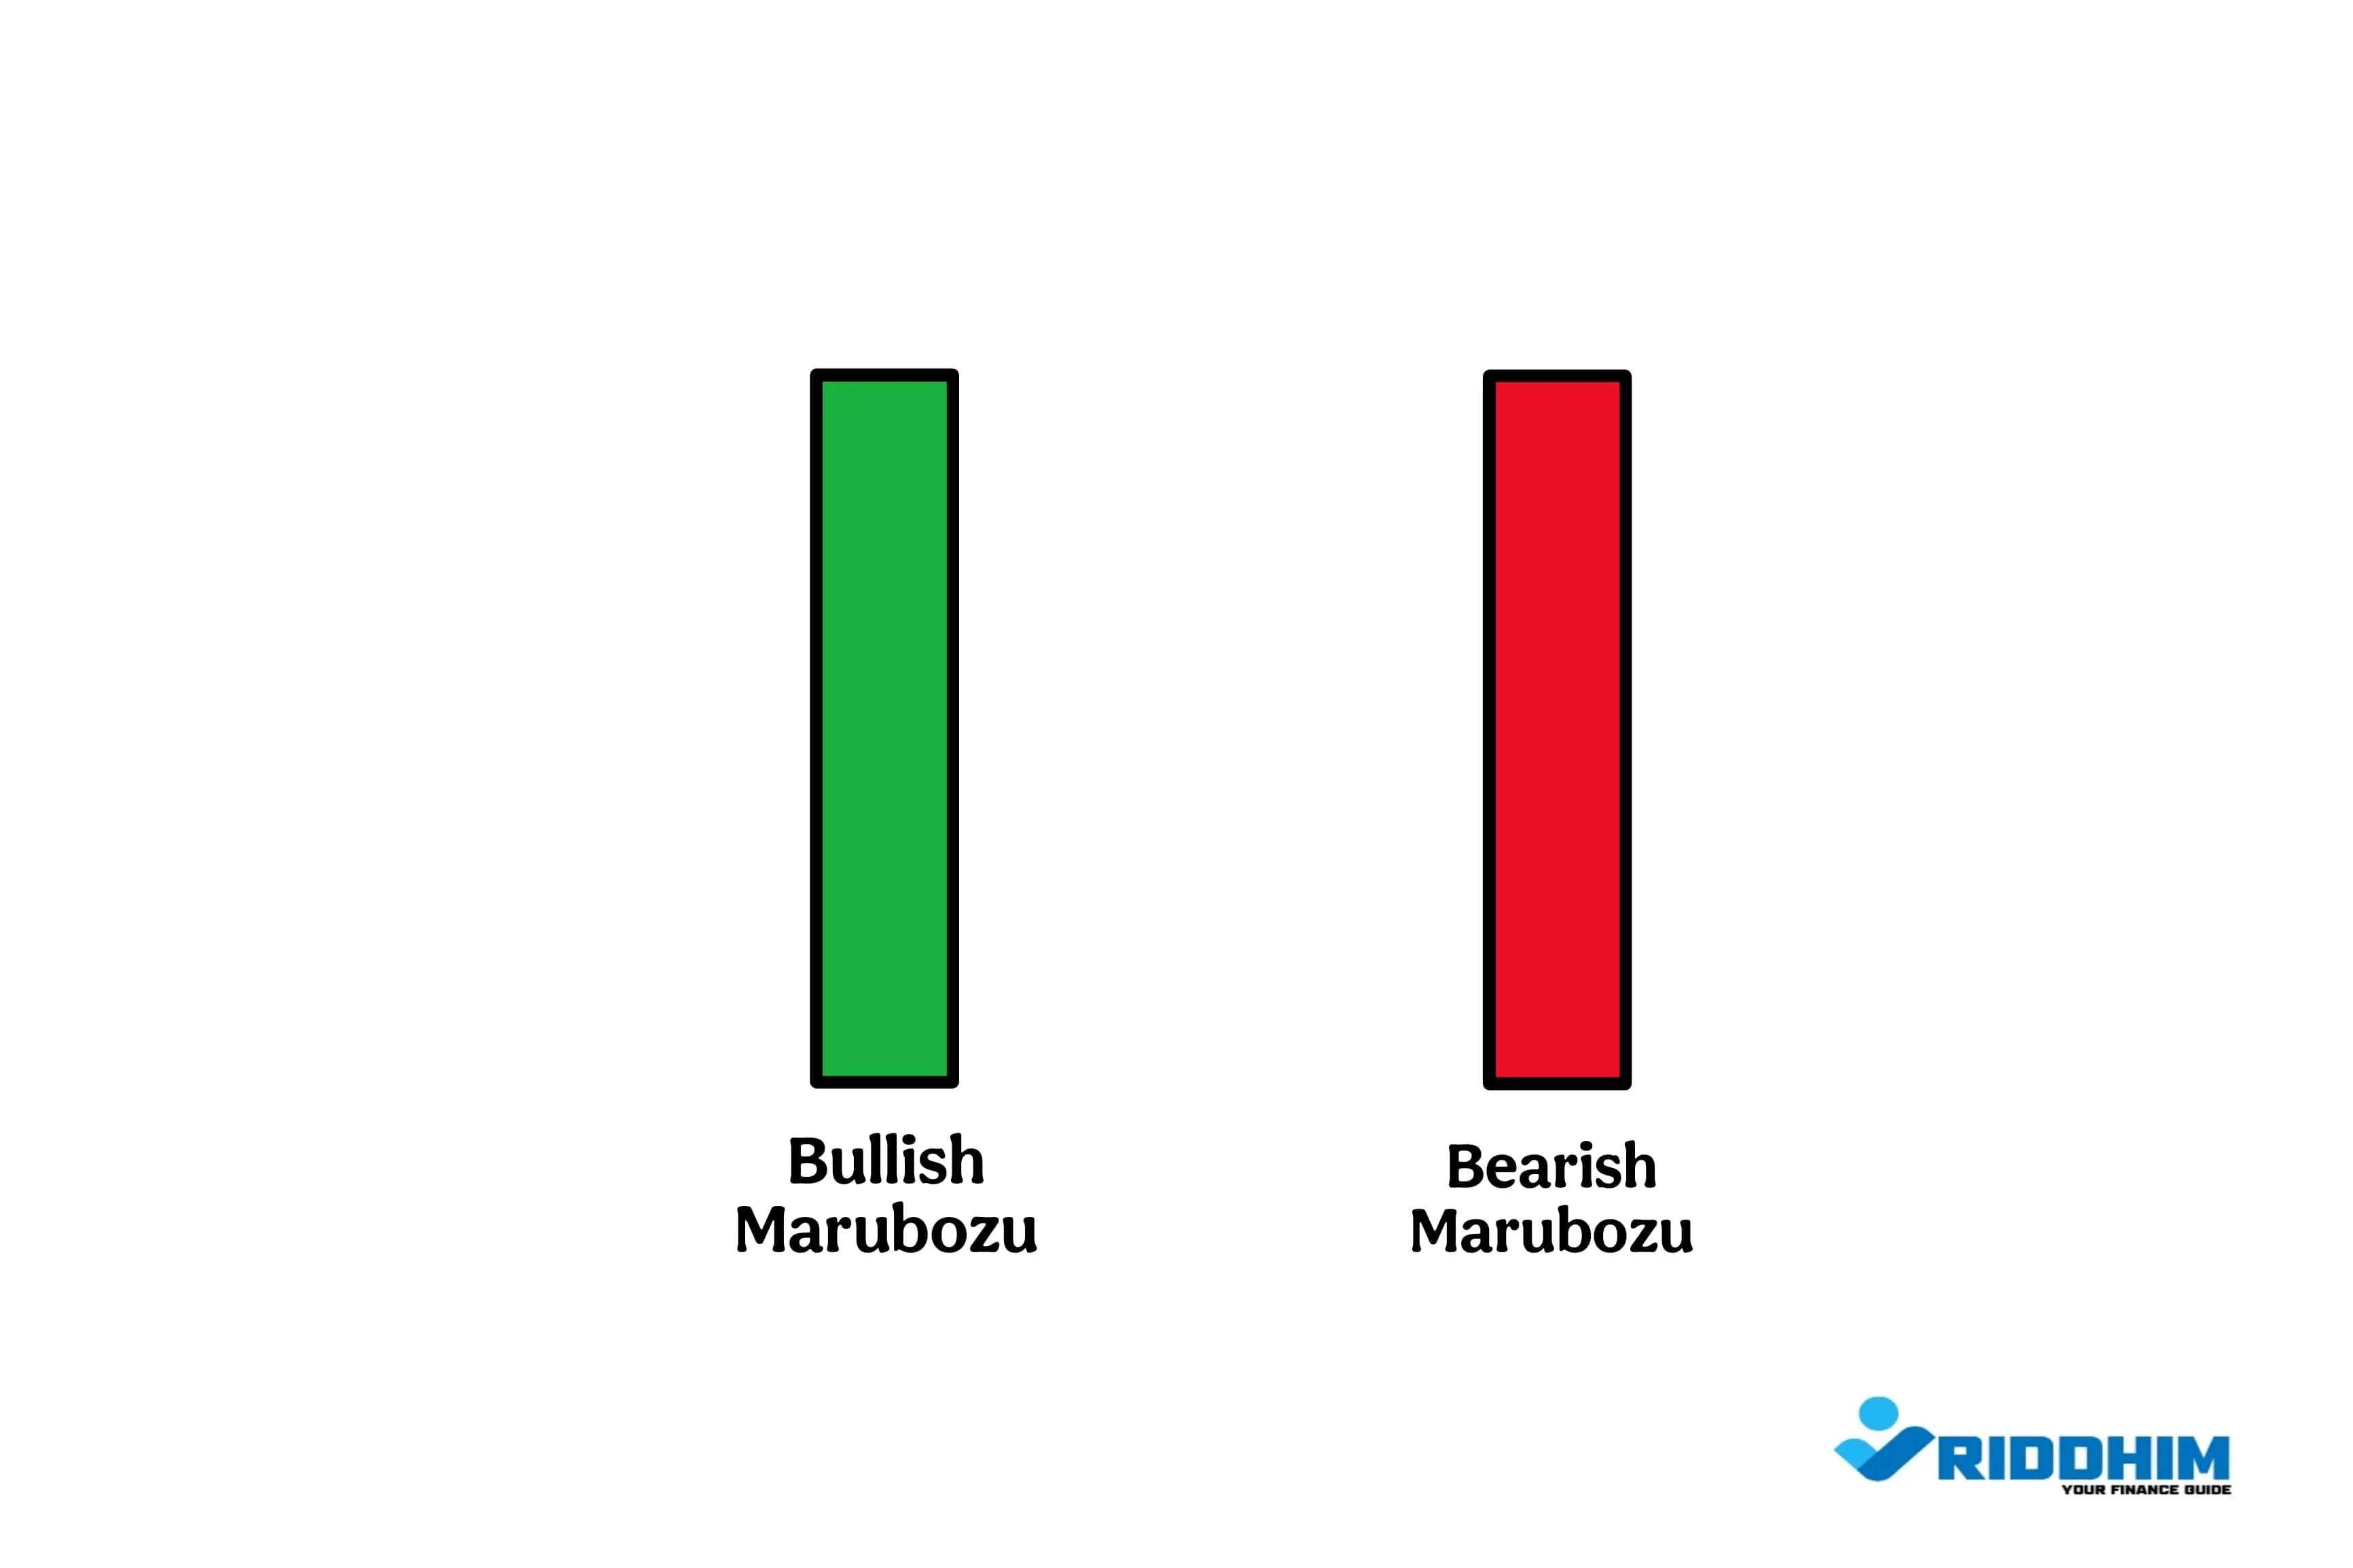
Illustration showing bullish and bearish marubozu candlesticks.
Why Marubozu Patterns Are Powerful
Most candlestick patterns rely on additional context or confirmation. But the Marubozu candle stands out because of its clarity. There is no uncertainty in this candle — it’s all buying or all selling. This shows strong momentum and often leads to price continuation or potential reversals.
Psychology Behind the Pattern
A Marubozu reflects conviction. It’s a strong signal of emotion in the market. When you see a bullish Marubozu, it means buyers didn’t allow sellers any chance throughout the day. Similarly, a bearish Marubozu shows aggressive selling without any signs of recovery during that period.
How to Identify a Marubozu
To spot a Marubozu candlestick, look for these characteristics:
- No upper or lower wicks (or very tiny ones)
- A strong full body (preferably larger than surrounding candles)
- Occurs near key support or resistance zones (for better confirmation)
Bullish Marubozu: Buyer's Day
This candle opens at the lowest price of the day and closes at the highest. It often signals the start of an uptrend or a continuation of an existing bullish trend.
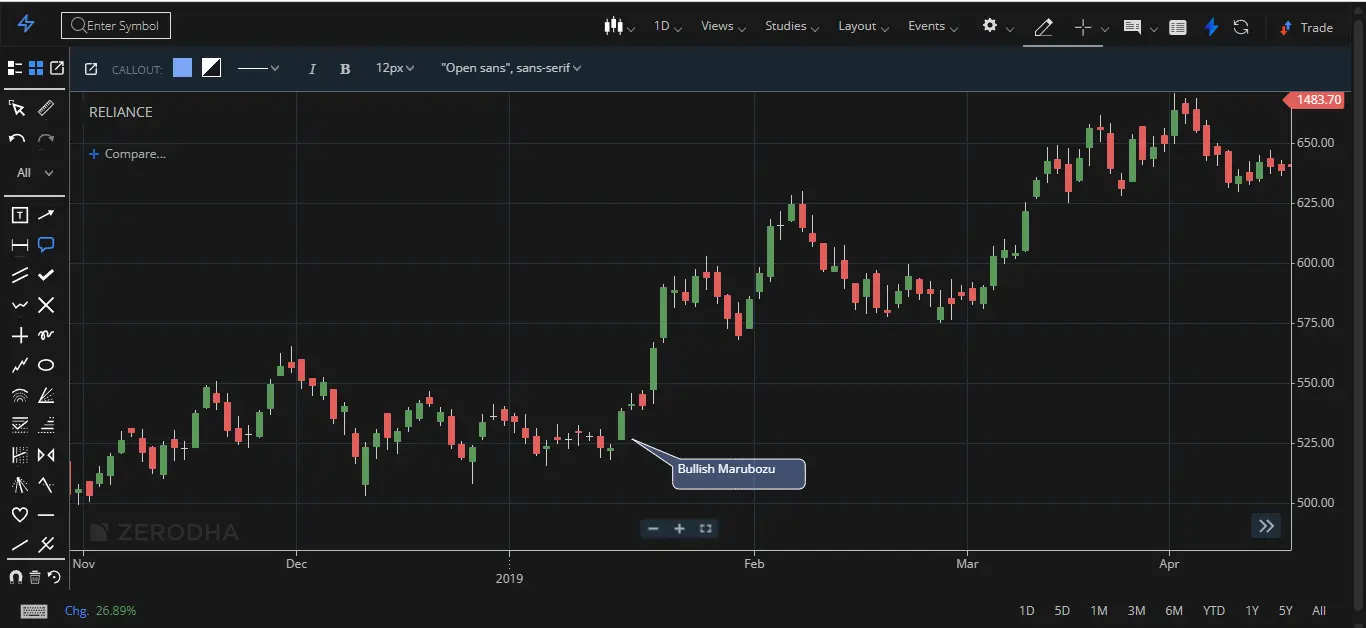
A strong bullish marubozu candle in an uptrend.
Best Use Cases:
- Breakout from a consolidation zone
- Reversal after a prolonged downtrend
- Confirmation of continued buying momentum
Example: Imagine a stock opens at ₹450 and closes at ₹475 with strong volume and no wicks. That’s a textbook bullish Marubozu. It shows that buyers were in control all day — no hesitation, no back and forth.
Bearish Marubozu: Seller’s Control
This candle opens at the highest point and drops consistently till it closes at the lowest. It reflects intense selling pressure and is often seen during market corrections or trend reversals from bullish to bearish.
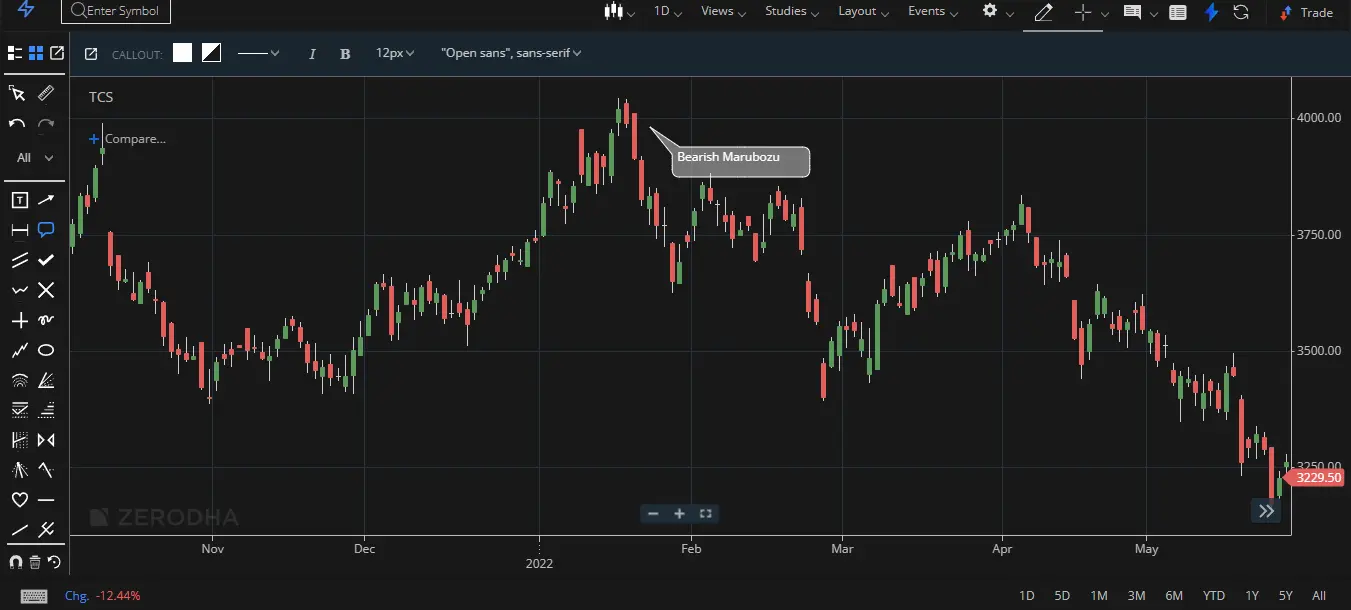
Bearish marubozu indicating strong selling pressure.
Best Use Cases:
- At the top of an uptrend (possible reversal)
- Confirmation of downtrend continuation
- Breakdown below key support
Example: If a stock opens at ₹700 and slides down to close at ₹678 with no shadows, it shows sellers didn’t let the price recover even slightly. That’s a classic bearish Marubozu.
How to Trade Using the Marubozu Candle
Entry Strategy
- For quick traders: Enter near the candle’s close if volume and trend support it.
- For safer traders: Wait for next candle confirmation (especially on daily or weekly charts).
Stop Loss Strategy
- Bullish Setup: Place stop-loss just below the low of the Marubozu candle.
- Bearish Setup: Place stop-loss just above the high of the Marubozu candle.
Exit Strategy
- Use previous resistance (for bullish) or support (for bearish) as exit levels
- Look for RSI or MACD divergence for early exit signs
Marubozu + Volume: A Strong Combo
The reliability of a Marubozu candle improves significantly when it is accompanied by above-average volume. Volume validates the strength of the move. If there’s a bullish Marubozu with heavy volume, it shows genuine buying. If the volume is low, it could be a false signal.
Limitations of the Marubozu Pattern
- Doesn’t always predict long-term trend — best for short to medium-term
- Not reliable during low volume sessions
- Can give false signals during news events or earnings days
Conclusion
The Marubozu candlestick pattern is a fantastic tool to add to your trading knowledge. It may look simple, but its strength lies in the clear message it conveys: domination. Whether it’s the buyers or sellers — when a Marubozu candle appears, someone is clearly in charge.
It’s ideal for traders who prefer clean, strong signals and don’t want to second guess market sentiment. But like any tool, it should be used with context, proper risk management, and alongside other indicators to improve accuracy.
Practice spotting it on real charts, especially on daily timeframes, and test how it behaves with different stocks or indices. With time and discipline, you’ll start noticing how this simple pattern can give you an edge.