Paper Umbrella Candlestick Patterns
In the world of technical analysis, candlestick patterns are one of the most effective tools traders use to understand market psychology and predict potential reversals. Among the many, the umbrella group — consisting of the Hammer, Hanging Man, and Shooting Star patterns — stands out due to their simplicity and clarity. These single-candle formations speak volumes, often appearing at key reversal zones and helping traders time their entries and exits.
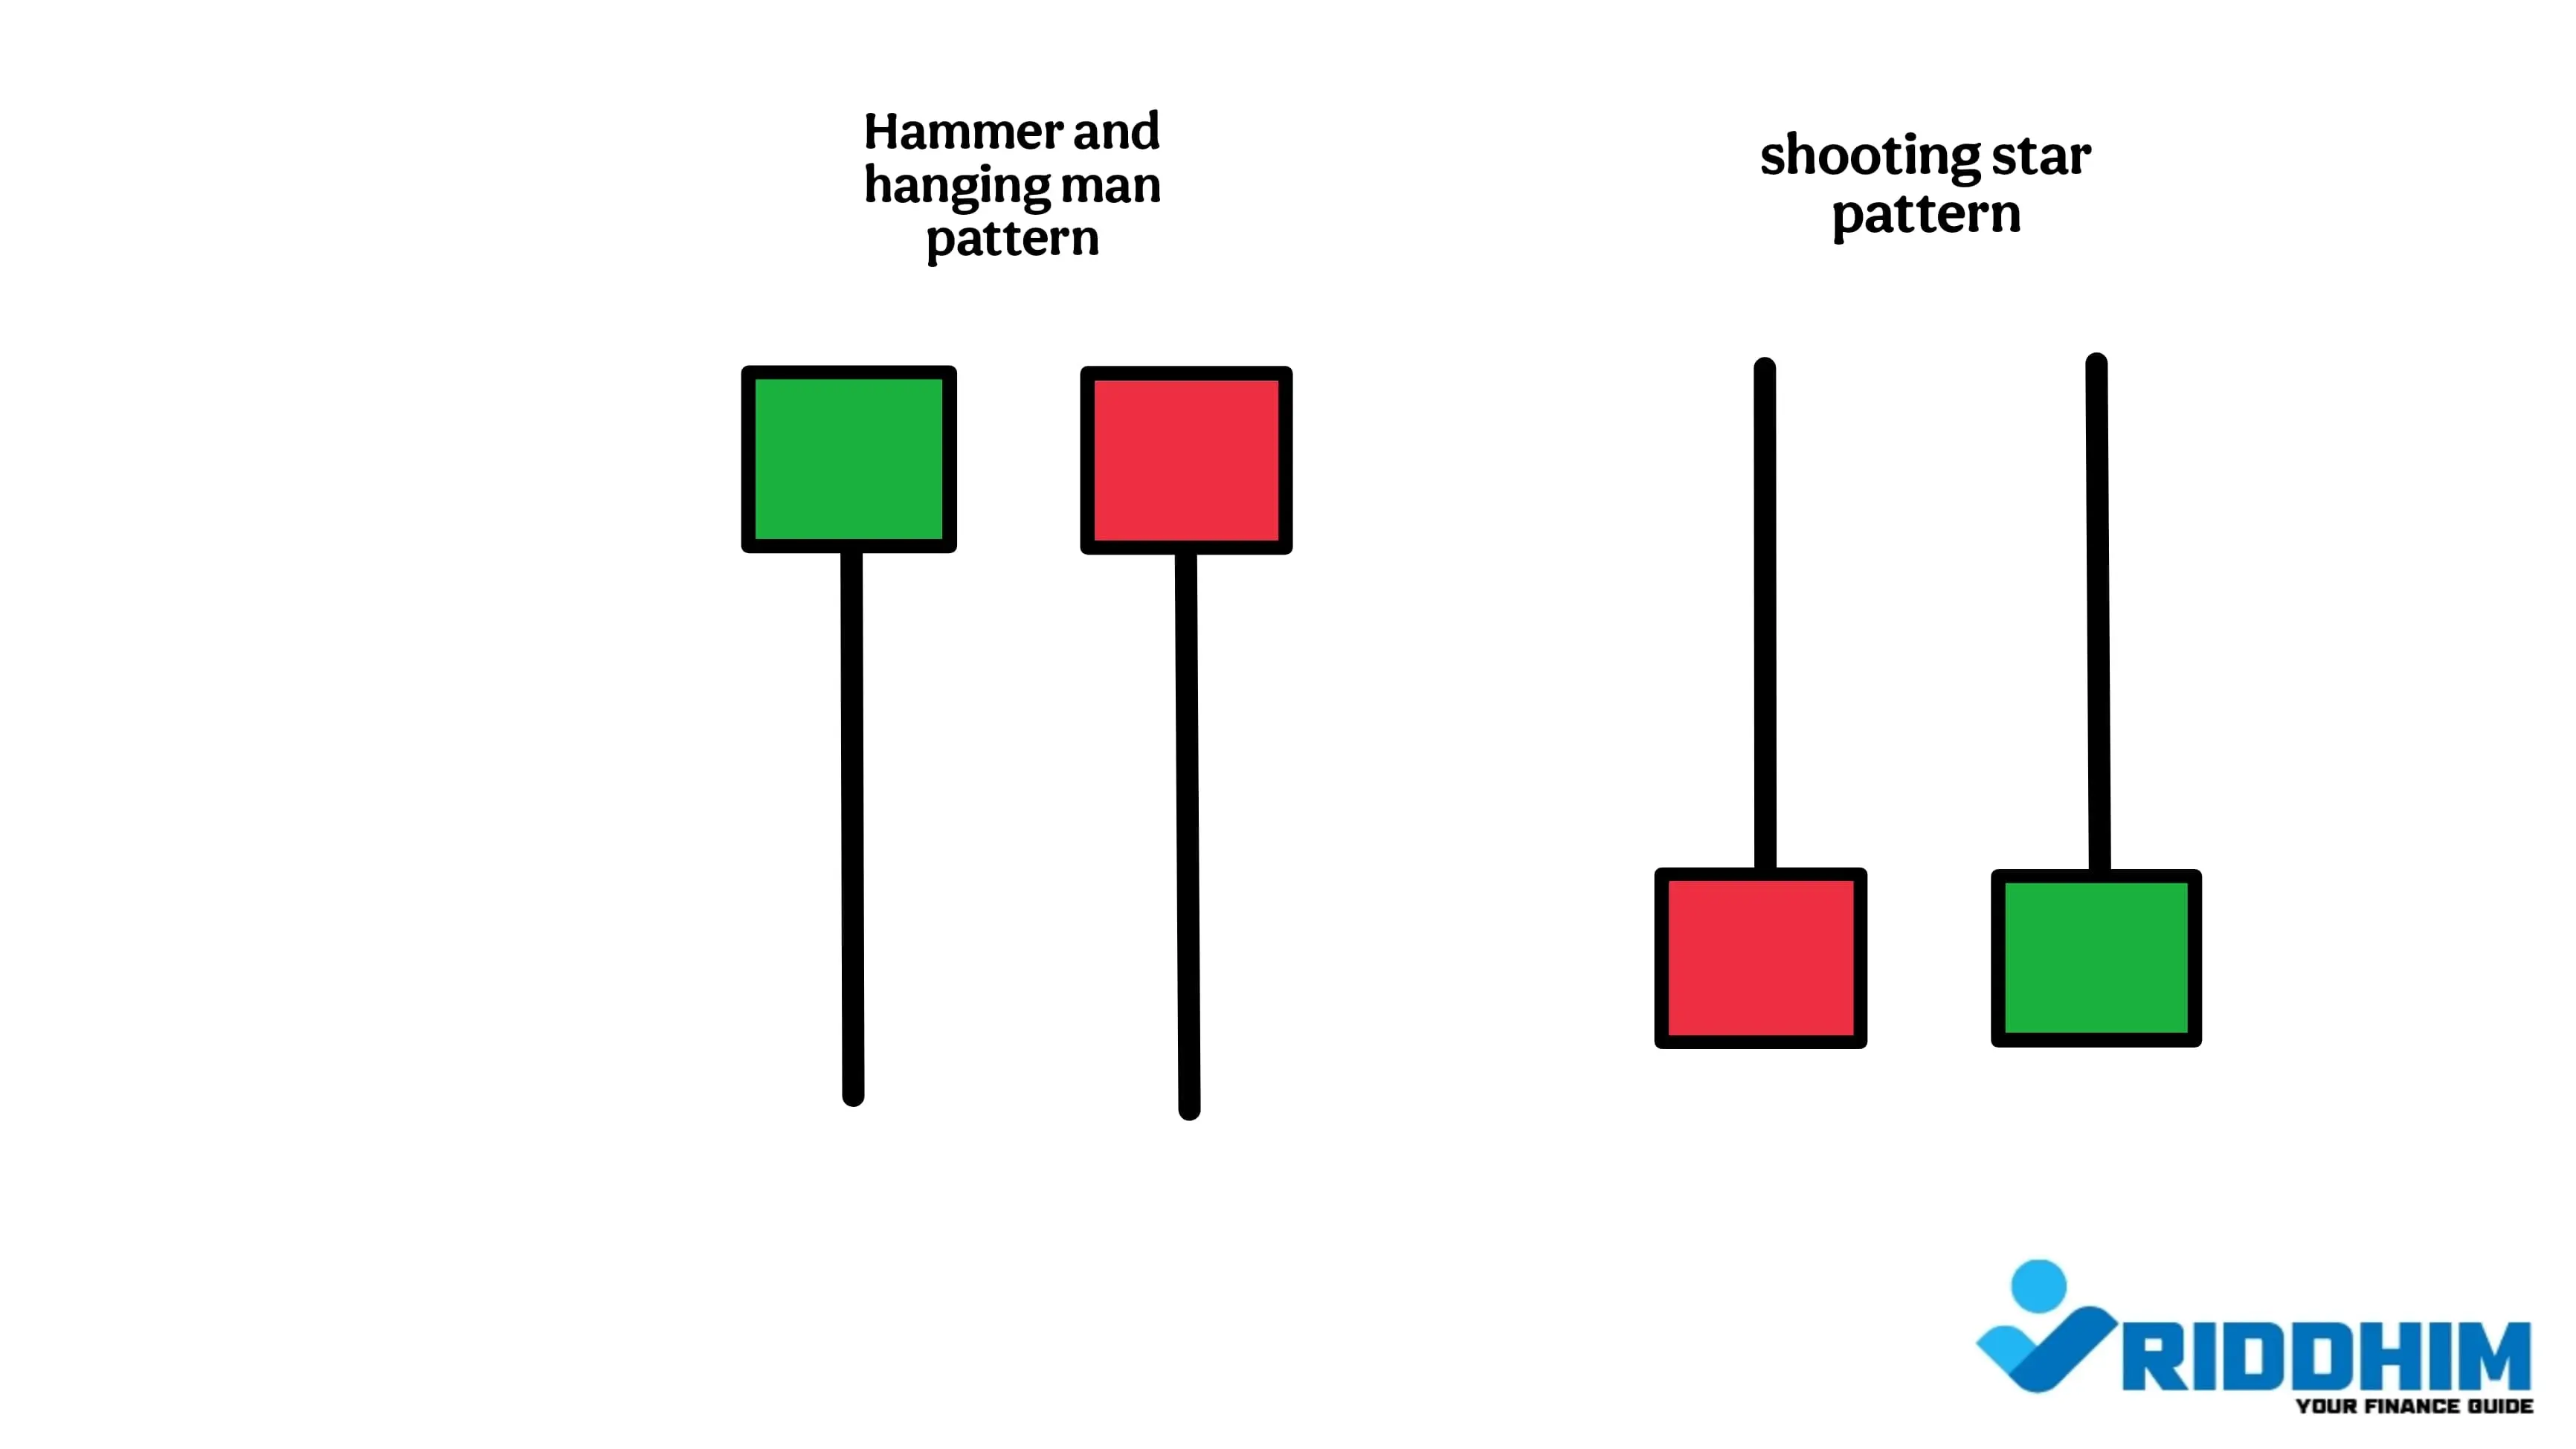
Visual representation of hammer, hanging man, and shooting star patterns.
What is a Paper Umbrella Candlestick?
A paper umbrella is a candlestick with a small real body and a long lower or upper shadow. The pattern forms when price action during a trading session moves significantly in one direction but closes near the open price, forming a shape that resembles an umbrella.
Depending on where the pattern appears on the chart and the trend that precedes it, it can be interpreted in two ways:
- Hammer: Appears at the bottom of a downtrend — indicates bullish reversal.
- Hanging Man: Appears at the top of an uptrend — signals possible bearish reversal.
- Shooting Star: Appears at the top of an uptrend — signals strong selling rejection after bullish pressure.
1. Hammer Pattern – Bullish Reversal

Hammer candlestick pattern observed after a downtrend.
The Hammer is a bullish reversal pattern that appears after a downward price movement. It shows that although sellers initially drove prices lower, buyers regained control and pushed the price back up near the opening level. This shift in momentum creates a signal that the downtrend may be ending.
Key Features:
- Small real body near the top of the range
- Lower shadow at least twice the size of the body
- Little to no upper wick
- Appears after a significant downtrend
Trading Tips:
Wait for confirmation via a bullish candle on the following session. Volume should ideally increase as the pattern forms. A stop-loss can be placed just below the low of the hammer.
2. Hanging Man Pattern – Bearish Reversal
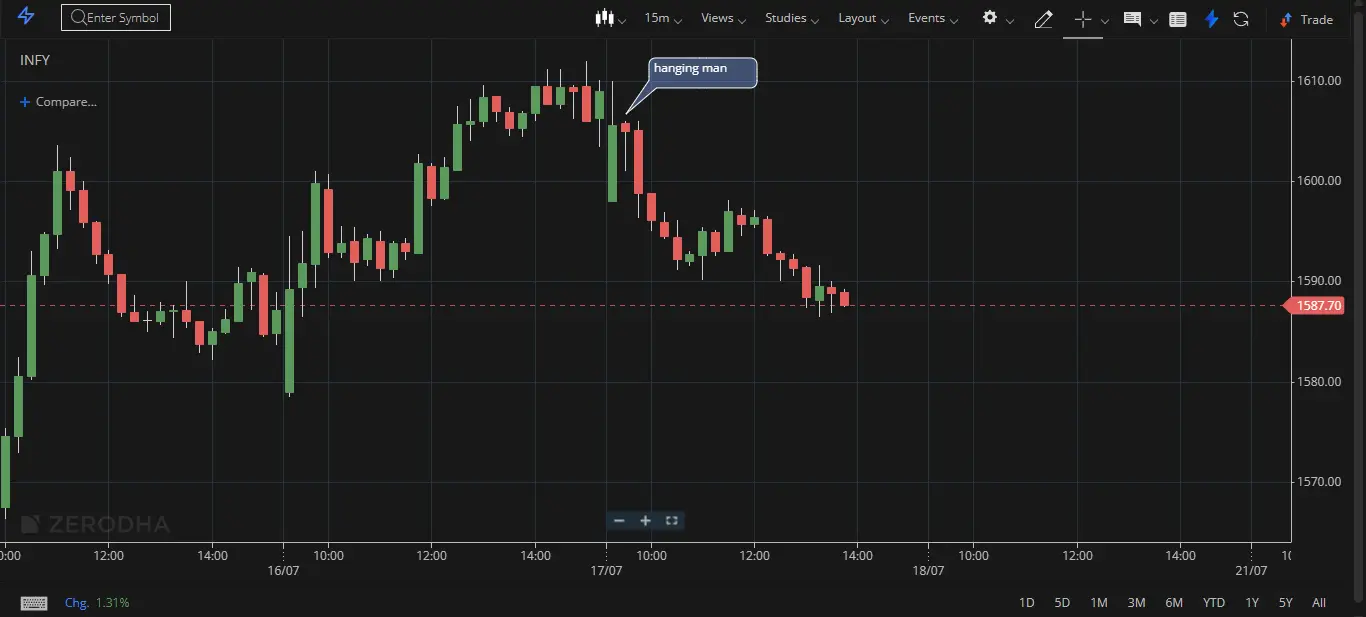
Hanging Man pattern indicating potential bearish reversal.
The Hanging Man pattern looks like a hammer but appears after a bullish trend. It warns that buyers are losing strength, and sellers may soon take over. The long lower shadow shows that sellers made an attempt to drive prices down during the session.
Key Characteristics:
- Occurs at the top of an uptrend
- Small body near the top of the candle
- Long lower shadow — at least 2x body size
- Little or no upper wick
Confirmation Needed:
Don't trade solely on this pattern. Wait for a bearish candle to close below the Hanging Man's body with decent volume. That’s your confirmation. Place a stop-loss above the high of the pattern.
3. Shooting Star Pattern – Bearish Reversal
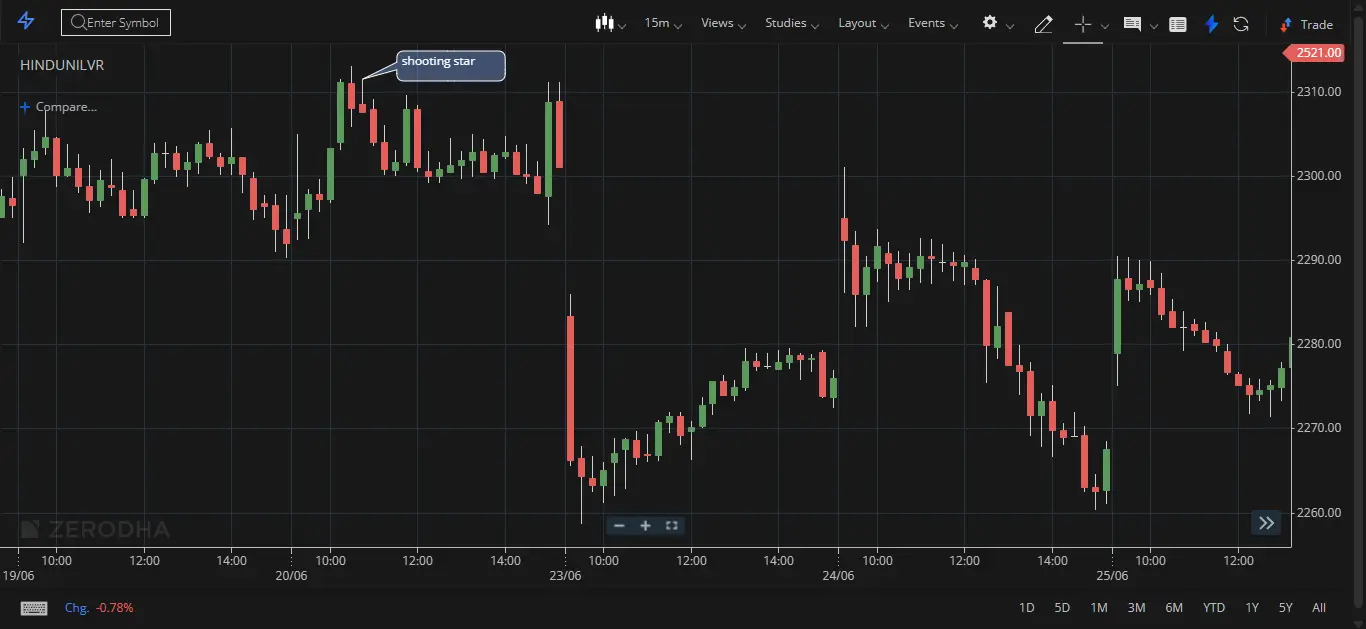
Shooting star pattern suggesting seller dominance.
The Shooting Star is a bearish reversal pattern that occurs at the top of an uptrend. It has a small body near the low and a long upper wick, which shows that buyers tried to push the price up but failed to sustain it. The sellers then stepped in, causing the price to close near the open.
How to Identify:
- Appears after a bullish rally
- Small real body near the bottom
- Upper shadow is at least twice the body size
- Little or no lower wick
How to Trade:
Look for a red candle after the shooting star. That acts as your confirmation. Traders may enter short trades at the close or next open, with stop-loss just above the high.
Psychology Behind Umbrella Patterns
These patterns give insight into emotional turning points in the market. They reveal failed efforts by one side — either bulls or bears — and signal a potential reversal in sentiment. When combined with trendlines, support/resistance, and volume analysis, they become powerful confirmation tools.
Important Reminders for Traders
- Use confirmation — never rely solely on a single candle.
- Check volume for strength behind the move.
- Be aware of the market trend — reversals happen at extremes, not in the middle.
- Apply technical indicators like RSI or MACD to support your analysis.
Summary – Key Takeaways
- Hammer: Bullish reversal from a downtrend
- Hanging Man: Bearish warning after an uptrend
- Shooting Star: Signals rejection of higher prices in uptrend
- All require confirmation — next candle and volume are key
- These patterns reflect crowd psychology — and give an edge when read correctly