Bullish & Bearish Engulfing Pattern
In the world of candlestick patterns, few formations carry as much weight as the Engulfing patterns — both Bullish and Bearish — along with their close cousins: the Piercing Pattern and Dark Cloud Cover. These multi-candle patterns don't just represent price action; they tell a deeper story about who’s winning the market tug-of-war: buyers or sellers. Understanding these patterns can greatly enhance your trading precision.
What Is an Engulfing Pattern?
An Engulfing Pattern is a two-candle reversal pattern that appears at the end of an existing trend. The key characteristic is that the second candle completely engulfs the real body of the first. These patterns are powerful signals when they appear near support/resistance zones or after a prolonged trend.
1. Bullish Engulfing Pattern
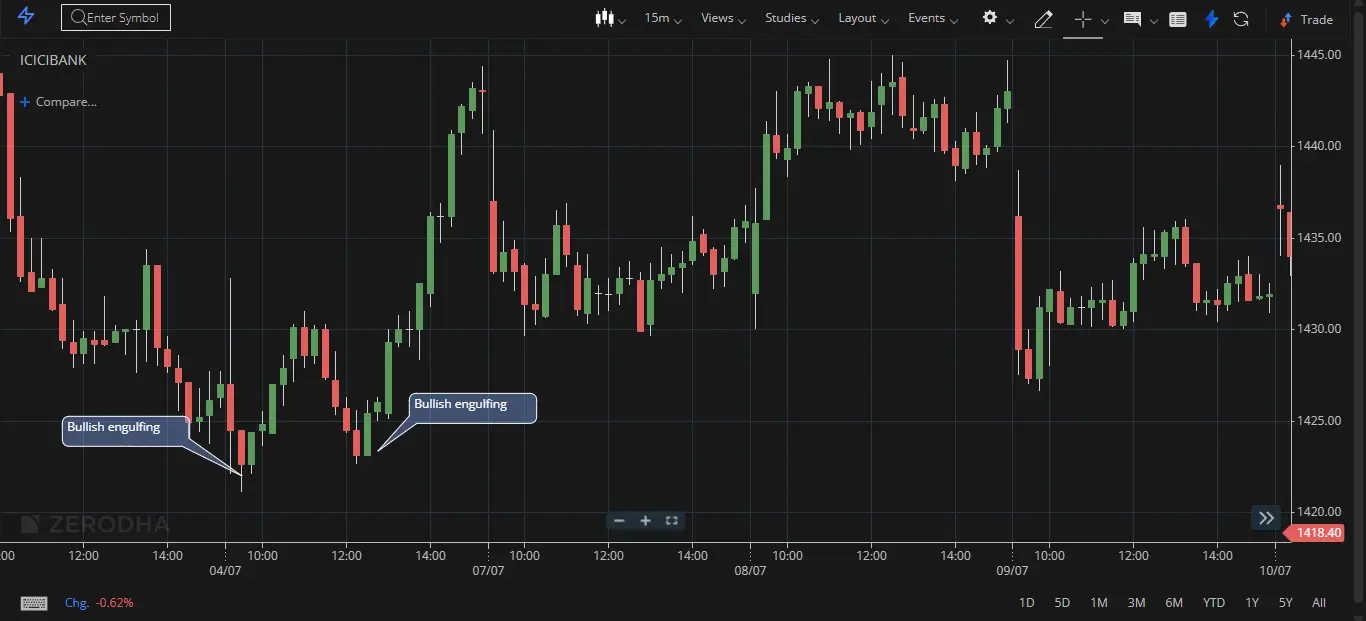
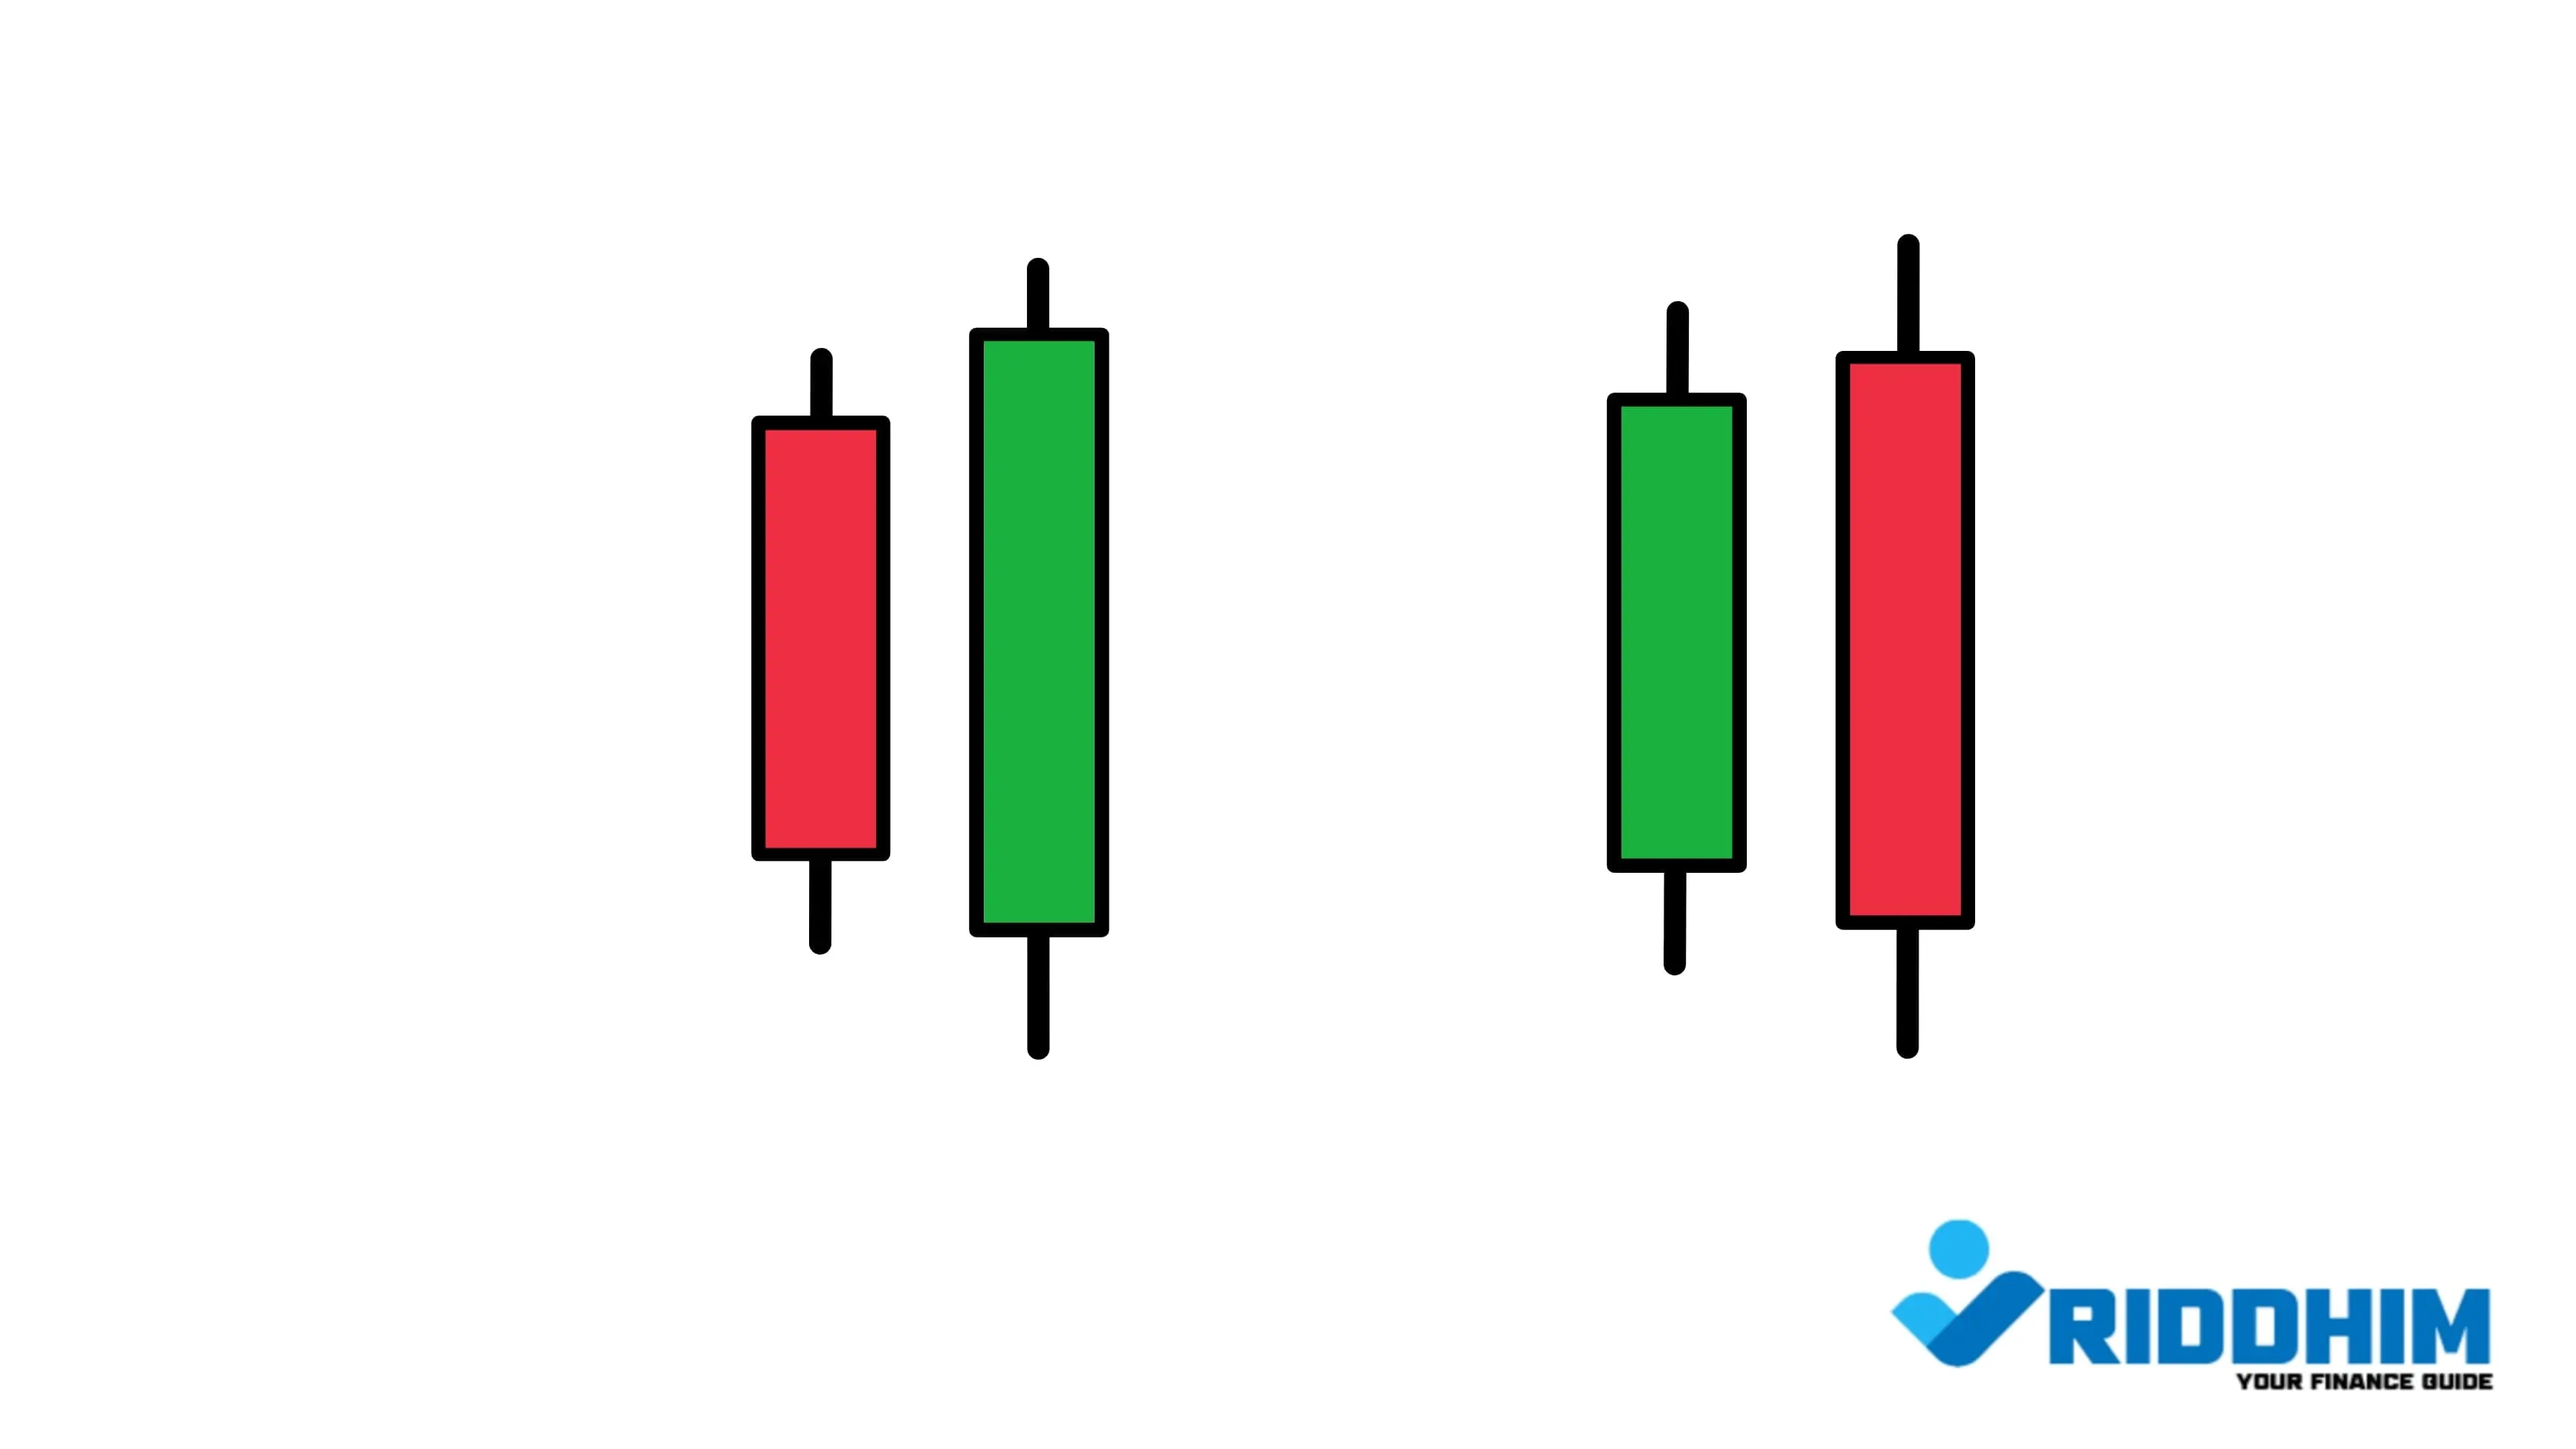
A Bullish Engulfing pattern appears at the bottom of a downtrend. The first candle is a small red (bearish) candle, showing continued selling pressure. The second candle is a large green (bullish) candle that opens lower but closes above the previous candle's open — fully engulfing it. This shows that bulls have stepped in aggressively.
How to Identify It:
- Occurs after a clear downtrend
- Candle 1: Small red body
- Candle 2: Large green body, completely covering Candle 1’s body
Trader Psychology:
After a period of decline, sellers appear confident — but the next day, buyers jump in with force, reversing momentum. This pattern often signals a potential trend reversal or a new bullish phase.
Trading Strategy:
- Entry: Near the close of the bullish candle (or next day on confirmation)
- Stop-loss: Below the lowest point of the pattern
- Confirmation tools: RSI divergence, support zone, volume spike
2. Bearish Engulfing Pattern
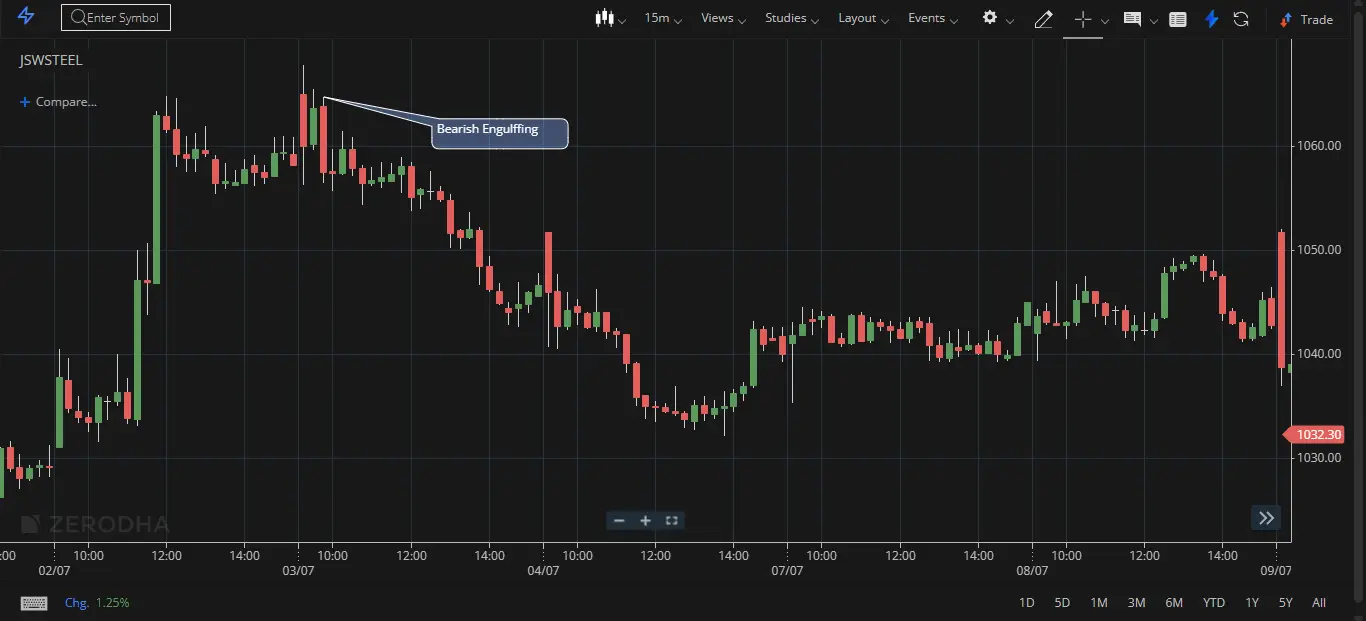
A Bearish Engulfing pattern occurs at the top of an uptrend. The first candle is a small green body, and the second is a large red body that fully engulfs the green. This suggests a shift from buying pressure to strong selling pressure.
How to Identify It:
- Occurs after a sustained uptrend
- Candle 1: Small green body
- Candle 2: Large red body engulfing Candle 1’s body
Trader Psychology:
After days of bullish control, the sudden bearish engulfing candle shows a shift in sentiment — warning of possible correction or reversal.
Trading Strategy:
- Entry: Near the close of the red candle (or on next candle confirmation)
- Stop-loss: Highest point of the two candles
- Volume confirmation adds weight to the pattern
3. The Piercing Pattern (Bullish Reversal)
The Piercing Pattern is similar to Bullish Engulfing but not as aggressive. The second bullish candle opens lower but closes within 50–99% of the previous bearish candle. This pattern still indicates a reversal, but requires confirmation.
- Occurs after a downtrend
- Candle 1: Strong red candle
- Candle 2: Opens below Candle 1, closes within upper half
- Confirmation: Next bullish candle or support zone validation
4. The Dark Cloud Cover (Bearish Reversal)
The Dark Cloud Cover is the opposite of the Piercing Pattern. It appears after an uptrend and warns of bearish reversal. The red candle opens above the green candle but closes into its body by 50–99%.
- Appears at the top of an uptrend
- Red candle opens above prior green candle
- Closes well into the green candle body
- Needs confirmation with a follow-up bearish candle
Doji + Engulfing = Strong Signal
If a Doji (sign of indecision) appears just before or after an Engulfing Pattern, it amplifies the importance of the setup. Doji followed by Engulfing shows that the market paused and then decisively reversed.
Summary and Pro Tips
- Bullish Engulfing = Green candle eats red, signals buying strength
- Bearish Engulfing = Red candle eats green, signals selling strength
- Piercing = Half engulf, less aggressive than full Bullish Engulfing
- Dark Cloud = Partial bearish version of Bearish Engulfing
- Use with volume indicators and confirmation candles
These candlestick setups are powerful not because they predict the future, but because they reflect real trader behavior. Combine them with context, volume, and confirmation tools to trade more intelligently.