Bullish and Bearish Harami Candlestick Patterns
Example of a Bullish Harami pattern on a candlestick chart
In technical analysis, candlestick patterns help traders read market psychology and anticipate possible price movements. Among them, the Harami pattern — which means “pregnant” in Japanese — stands out for its simplicity and reliability. This pattern occurs over two days and can signal a shift in trend direction.
What is a Harami Candlestick Pattern?
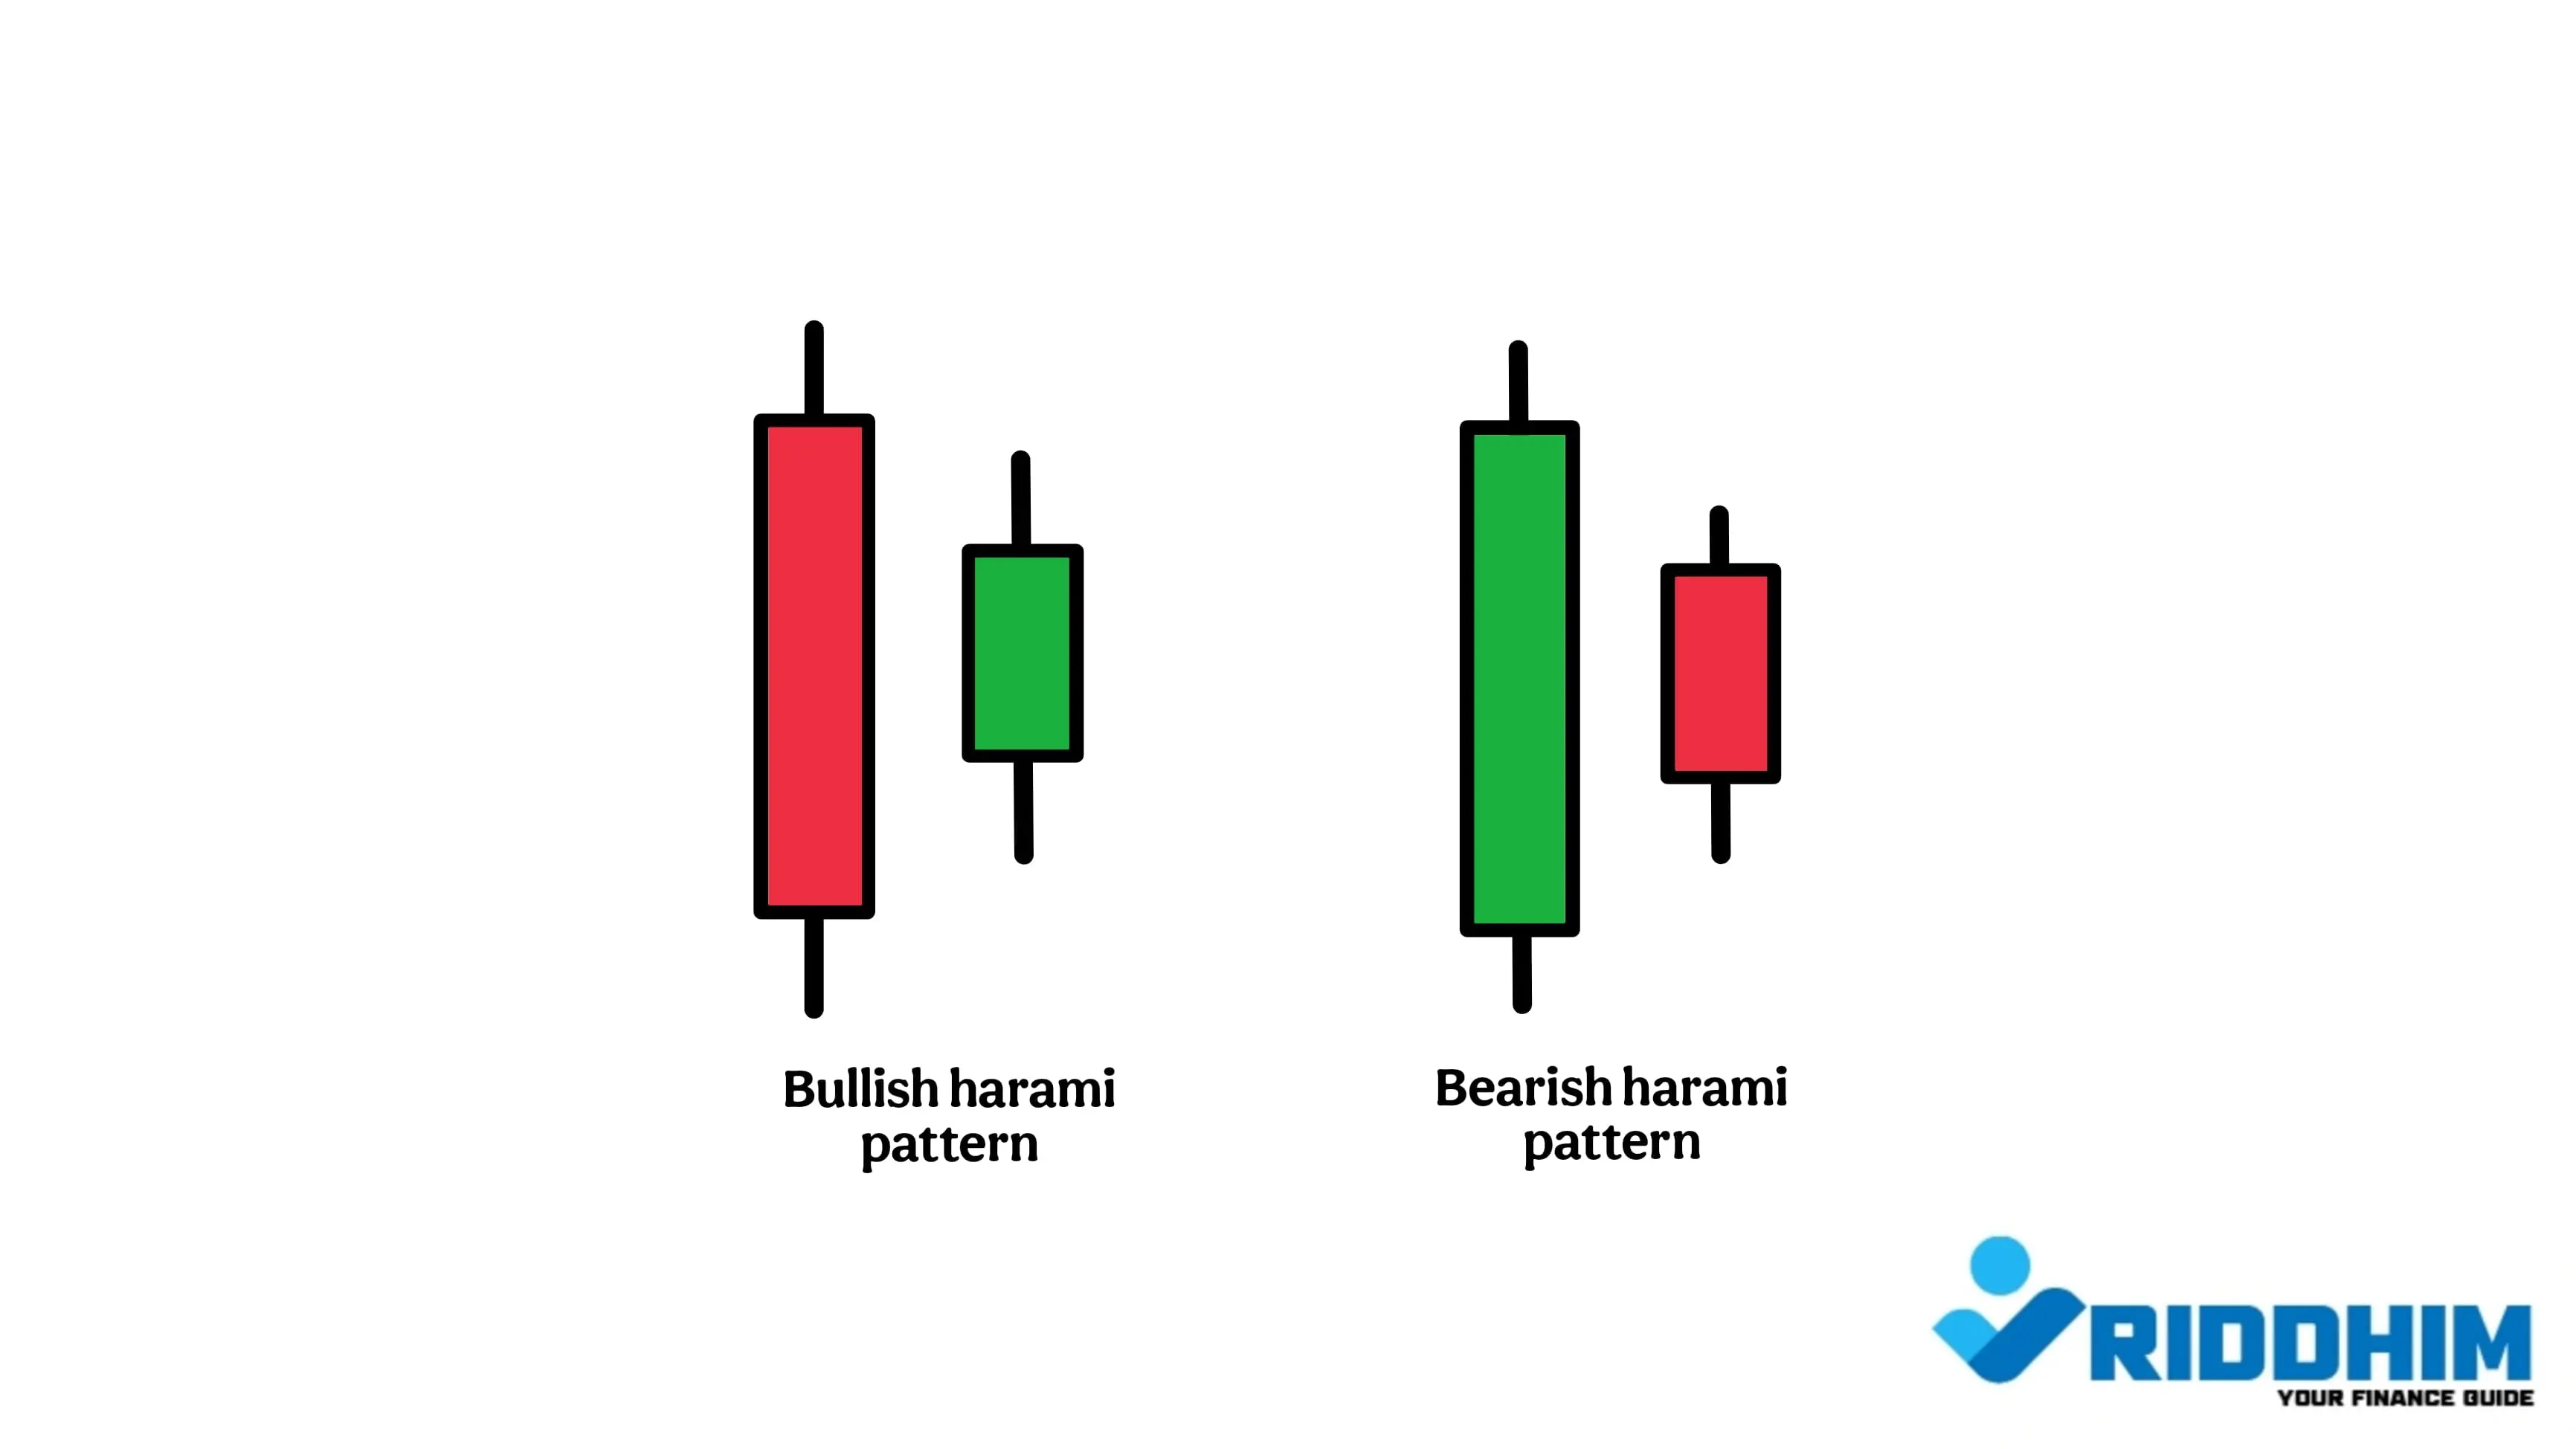
The Harami pattern is a two-candle formation. The first candle is usually large, showing strong momentum, followed by a smaller candle that is completely contained within the body of the first candle. This setup indicates indecision and a possible reversal.
- Bullish Harami: Appears during a downtrend and hints at a possible upward reversal.
- Bearish Harami: Forms after an uptrend and signals a potential downward shift.
Bullish Harami Pattern (Reversal Signal)
The Bullish Harami pattern shows up after a prolonged downtrend. The first candle is bearish and strong. On the next day, the price opens higher and closes higher, forming a small green (or white) candle within the body of the previous day’s candle. This pattern indicates that the sellers may be losing strength and buyers are starting to gain control.
How to Spot It:
- First candle: Long red (bearish) candle.
- Second candle: Small green (bullish) candle inside the body of the red candle.
- Appears after a clear downtrend.
Trading Tips:
- Enter a long trade after a bullish confirmation (like a strong green candle on Day 3).
- Place stop-loss below the low of the Harami pattern.
- Use volume confirmation or moving averages for stronger conviction.
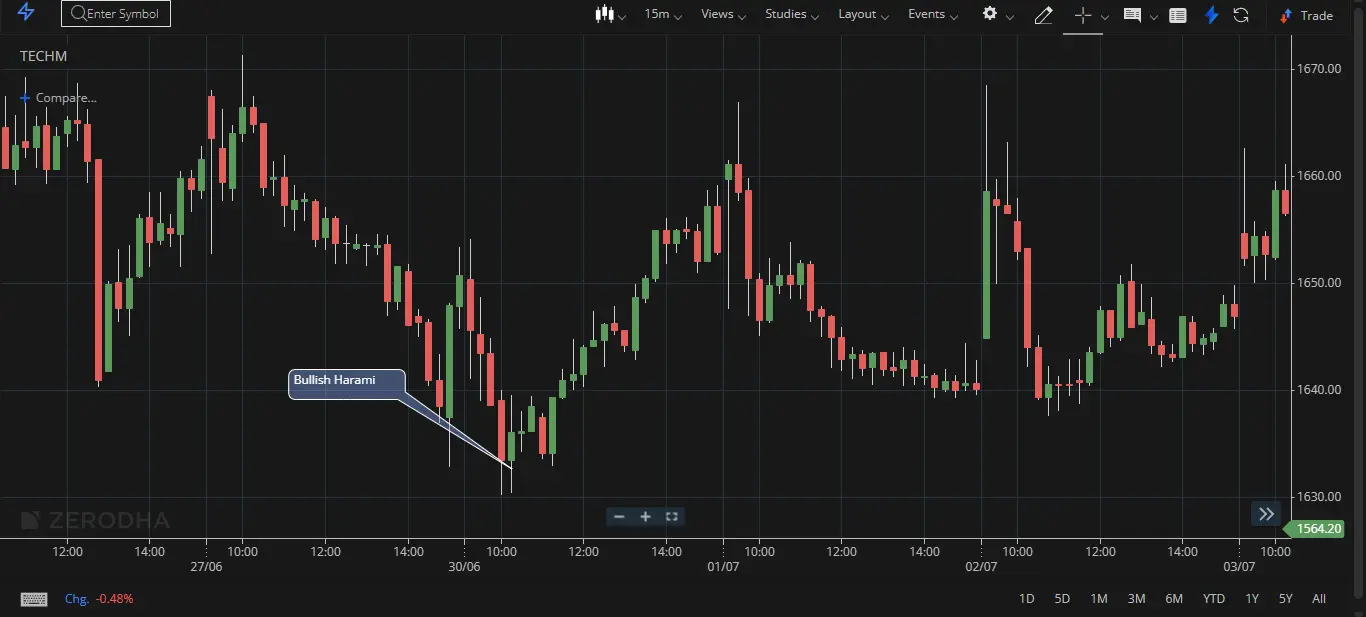
bullish Harami pattern example
Bearish Harami Pattern (Reversal Warning)
Opposite to the bullish setup, the Bearish Harami appears at the end of an uptrend. The first candle is a large green candle indicating bullish momentum, followed by a smaller red candle that fits inside the previous body. This suggests the bullish momentum is weakening.
How to Identify:
- First candle: Long green (bullish) candle.
- Second candle: Small red (bearish) candle within the previous candle’s body.
- Shows up after a strong uptrend.
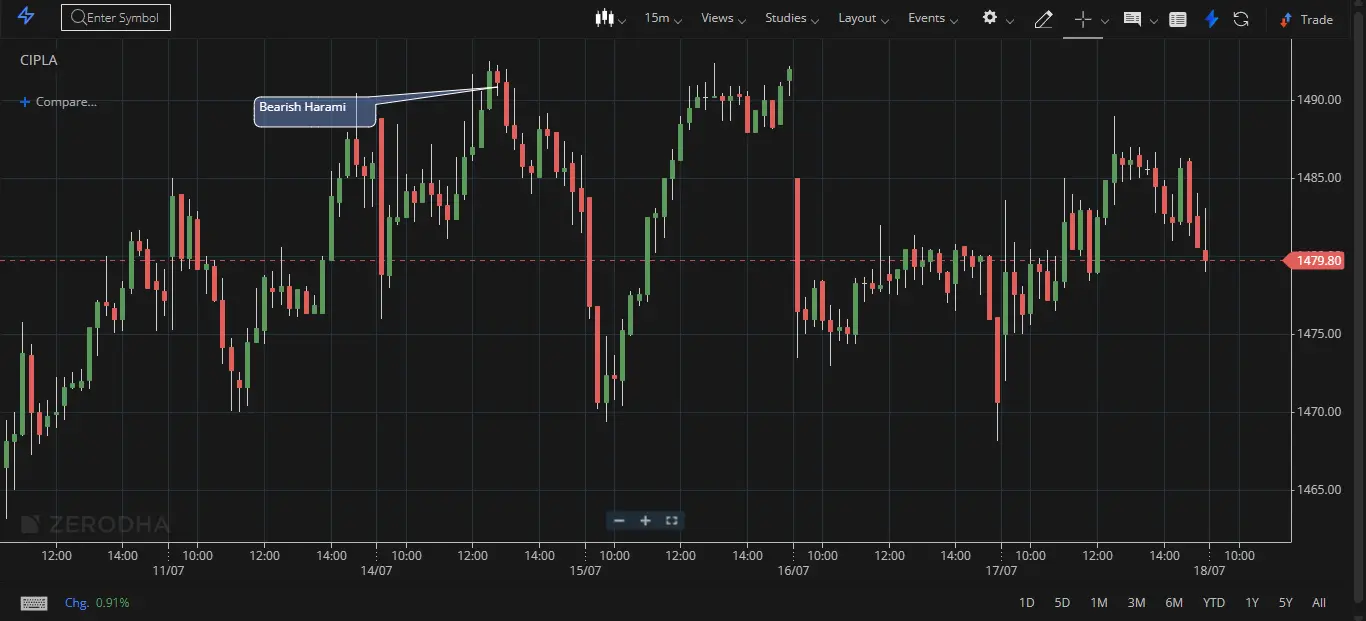
bearish Harami pattern example
Bearish Trade Setup:
- Wait for a red confirmation candle on Day 3.
- Enter a short position near the close of the confirmation candle.
- Use the pattern's high as your stop-loss level.
Real Example
Let's say a stock drops to ₹810 with a strong red candle (Day 1). The next day it opens at ₹824 and closes at ₹835 forming a small green candle. This setup looks like a Bullish Harami — indicating a potential reversal. Traders might enter at ₹835 with a stop-loss around ₹810.
Similarly, in an uptrend, a stock moves to ₹129 and forms a big green candle. The next day, it opens lower at ₹126 and forms a small red candle closing at ₹124. This could be a Bearish Harami pattern — signaling caution or a reversal ahead.
Pro Tips for Harami Patterns
- Always use trend context — Harami patterns are powerful only when they appear at the right place.
- Combine with indicators like RSI, MACD, or Volume for stronger confirmation.
- Use a good risk-reward ratio (at least 1:2 or 1:3).
- Watch for fakeouts — not all Haramis lead to reversals.
Summary
- Harami is a 2-candle pattern signaling reversal.
- Bullish Harami comes after a downtrend.
- Bearish Harami appears after an uptrend.
- Use confirmation, trend context, and proper stop-loss.
- Combine with indicators for better accuracy.